[ 01 · Fintech · 3-year retainer ]

Risk analytics, built for the people who manage money

Three years as senior UI/UX designer for a portfolio and risk analytics platform for investment teams, from v1 to its third funding round.

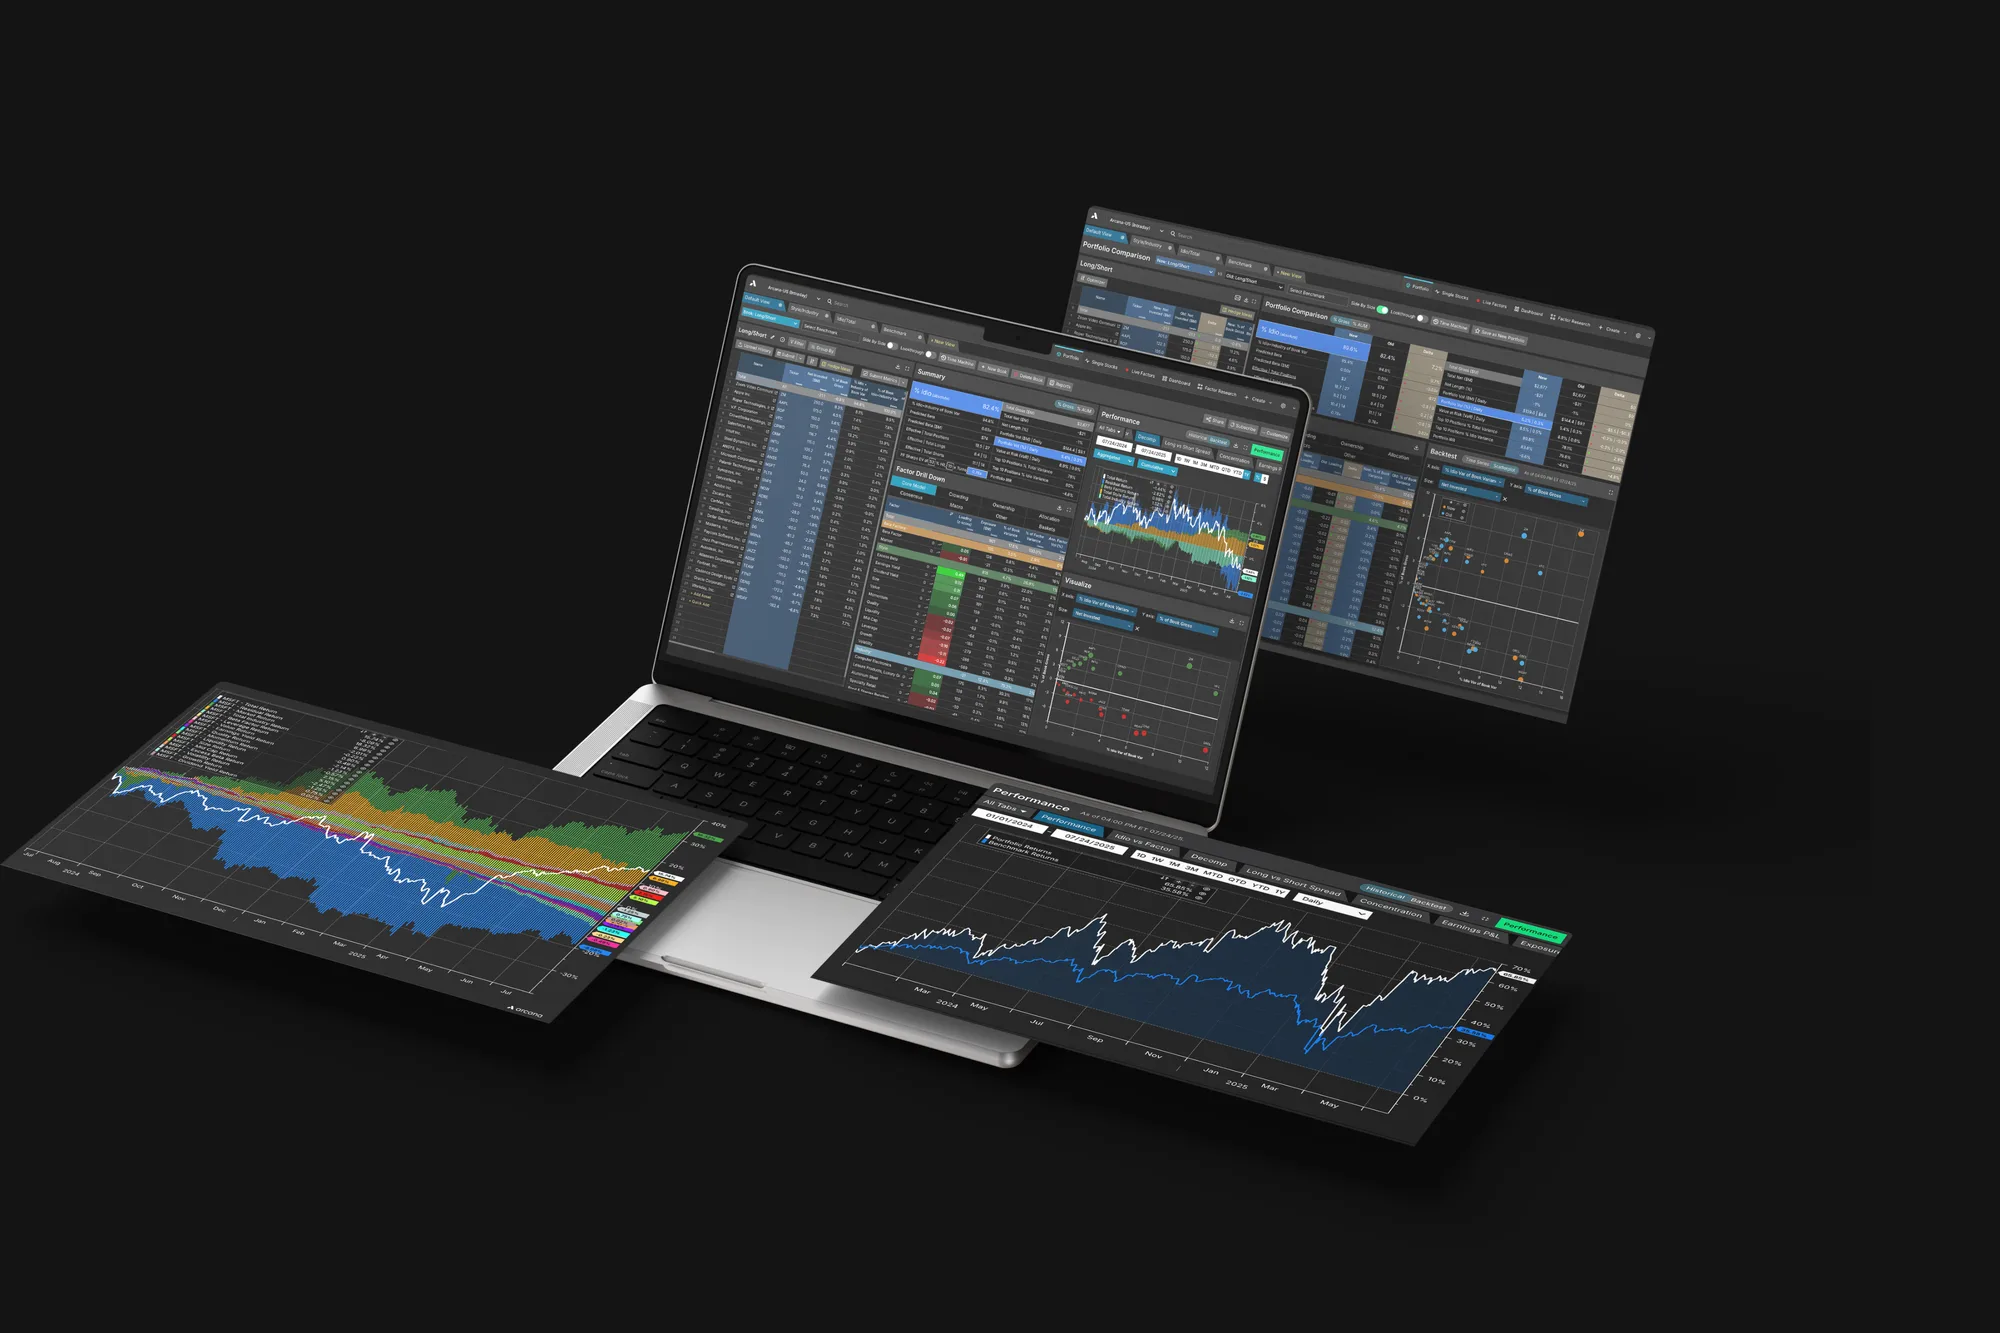
The platform across a laptop and floating screens: portfolio tables, factor exposure and performance charts
Client
Fintech startup — portfolio and risk analytics for investment teams
My role
Senior UI/UX Designer, through an agency
Length
3-year retainer
Platforms
Web platform · iOS app · design system · marketing assets
Outcome
Launched; retained for 3 years; client now raising its third round
01

The ask

The founders knew what they wanted analysts to be able to do: see a portfolio's risk, test it against scenarios and act on it. How it should work was wide open. Every feature started as a request, not a spec.

02

The constraints

  • Dense financial data: tables, time series, factor models and stress scenarios on one screen.
  • Expert users who live in the tool all day and notice every extra click.
  • A small team shipping fast, so every design had to be buildable as handed off.
  • Screens that held up from large monitors down to laptops.
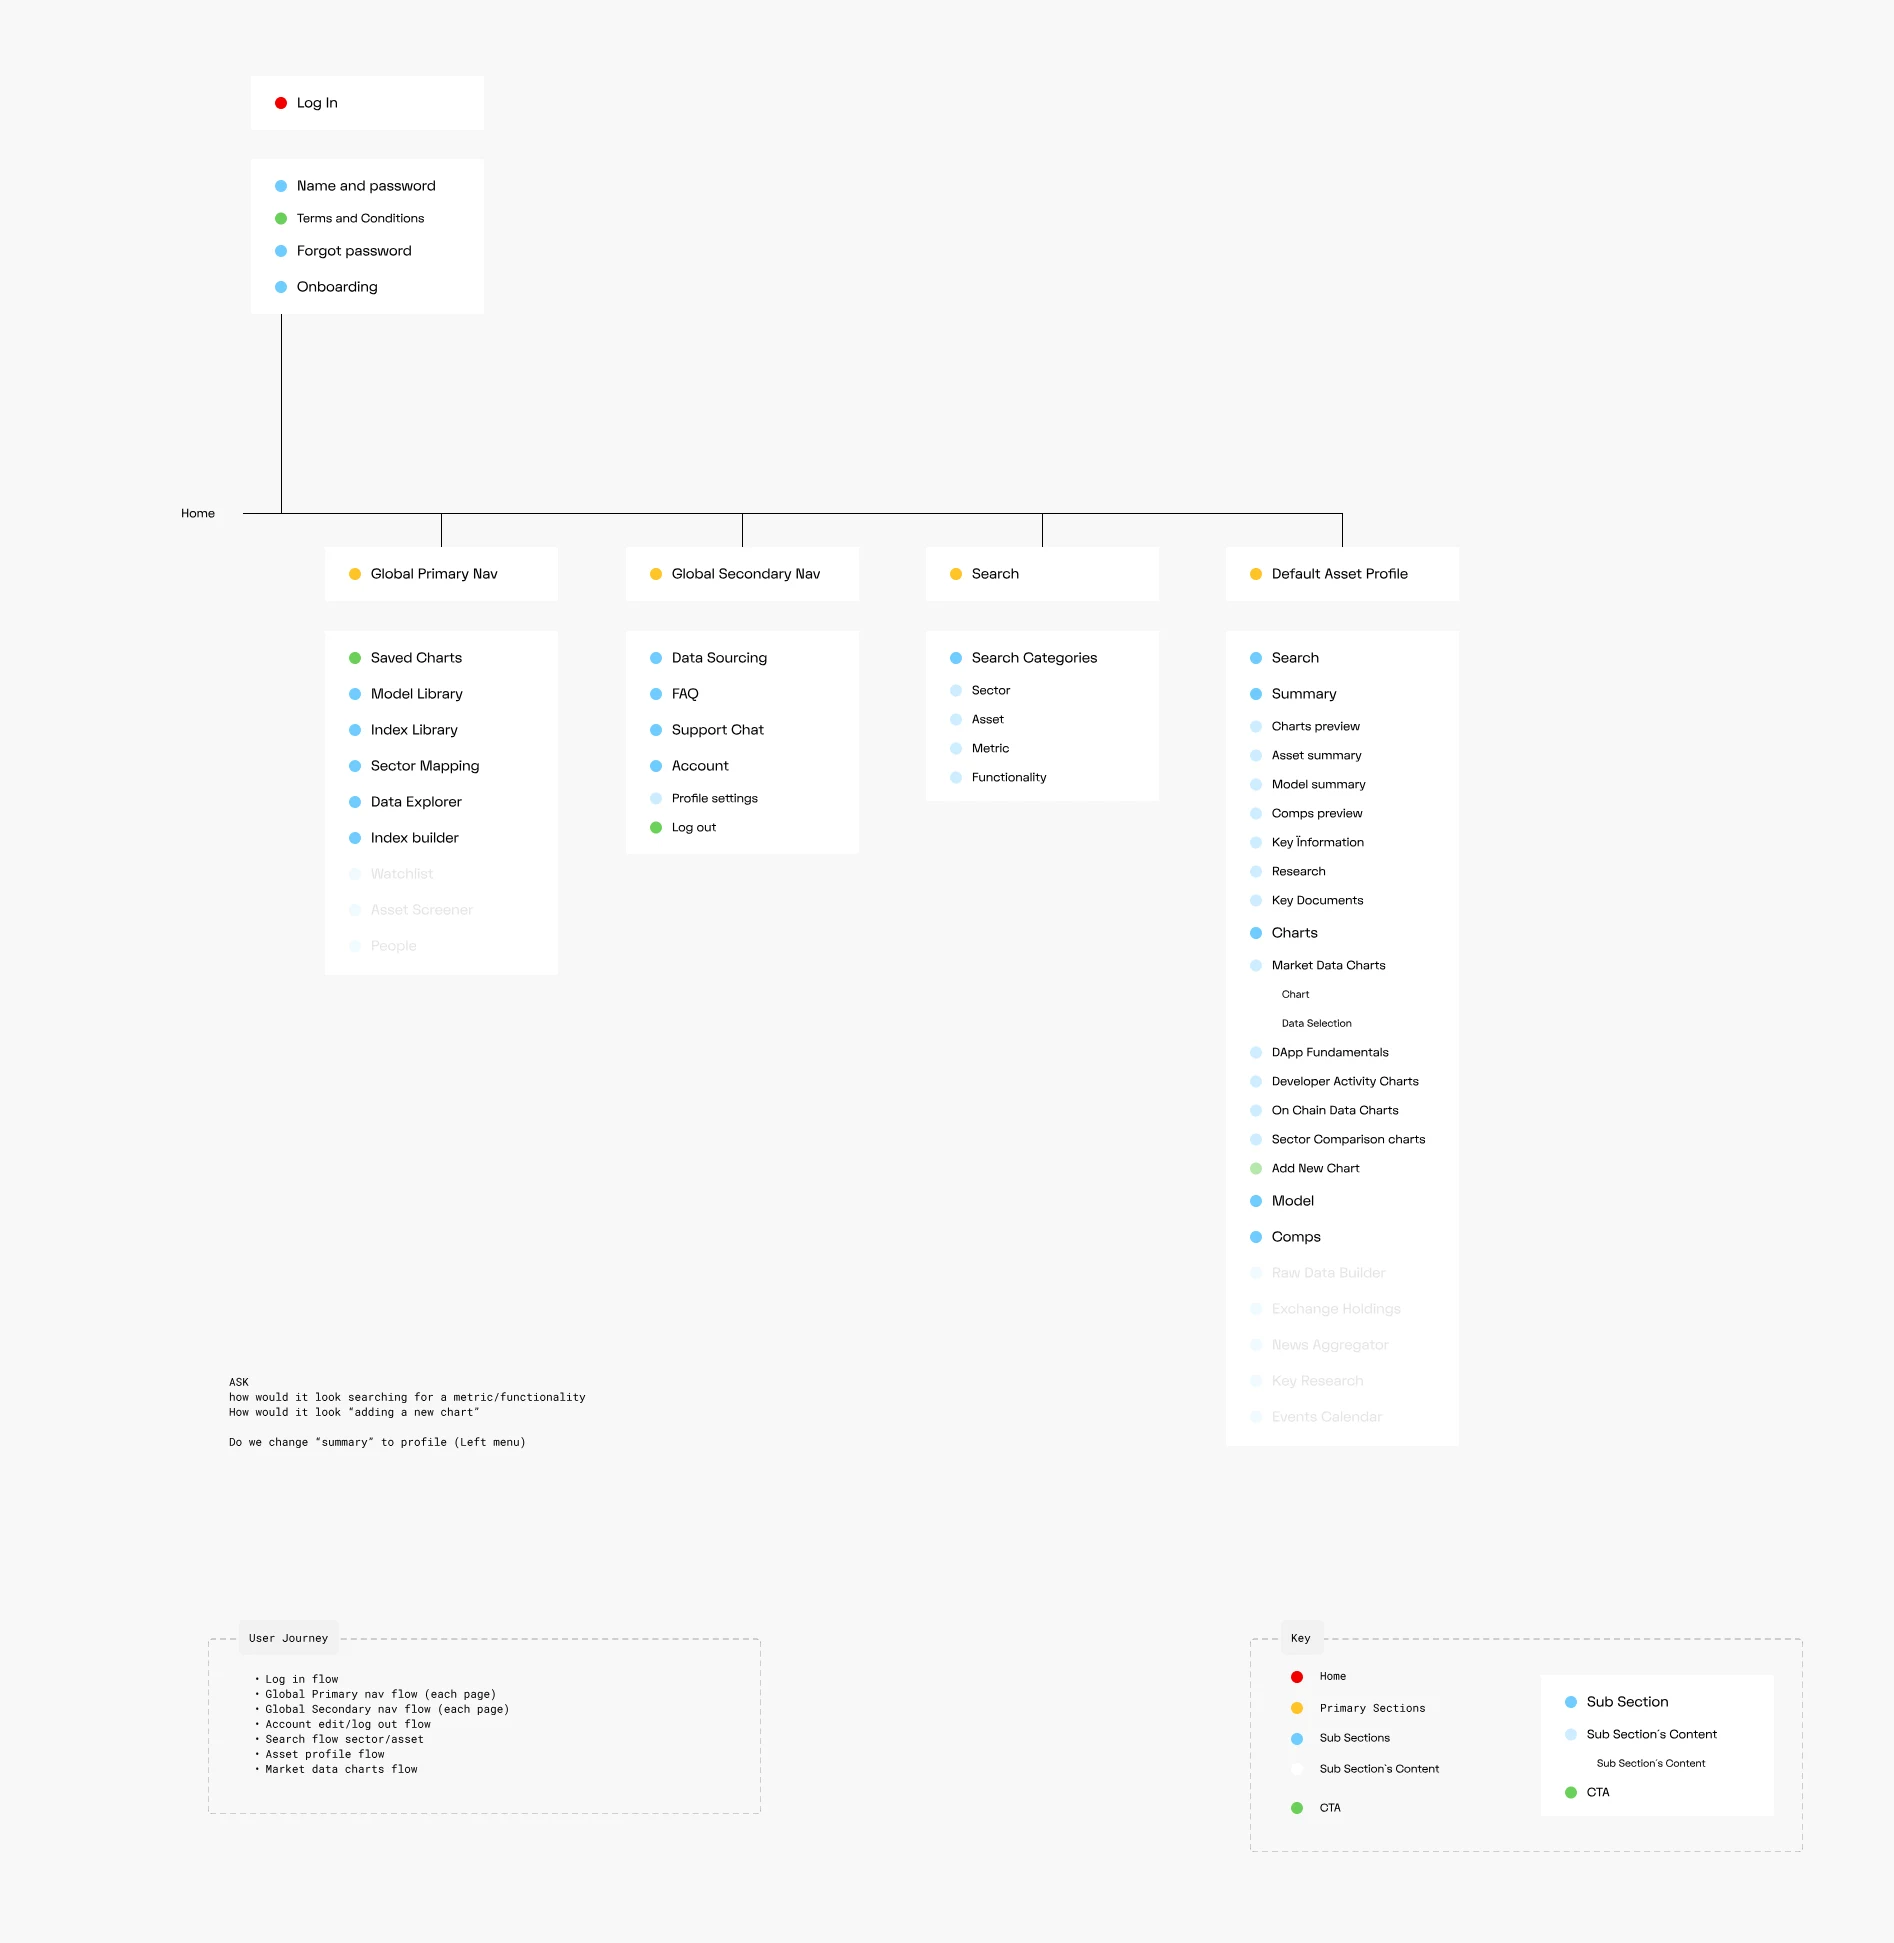
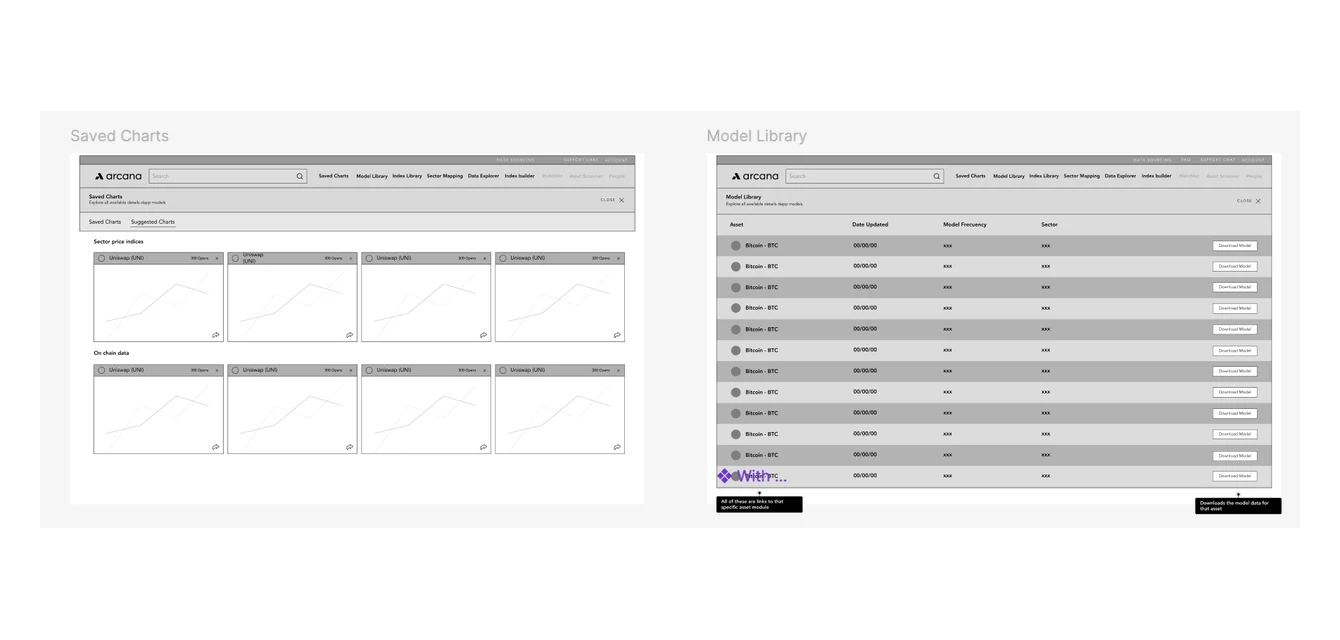
MVP information architecture: log-in flow, global navigation, search and the asset profile sections
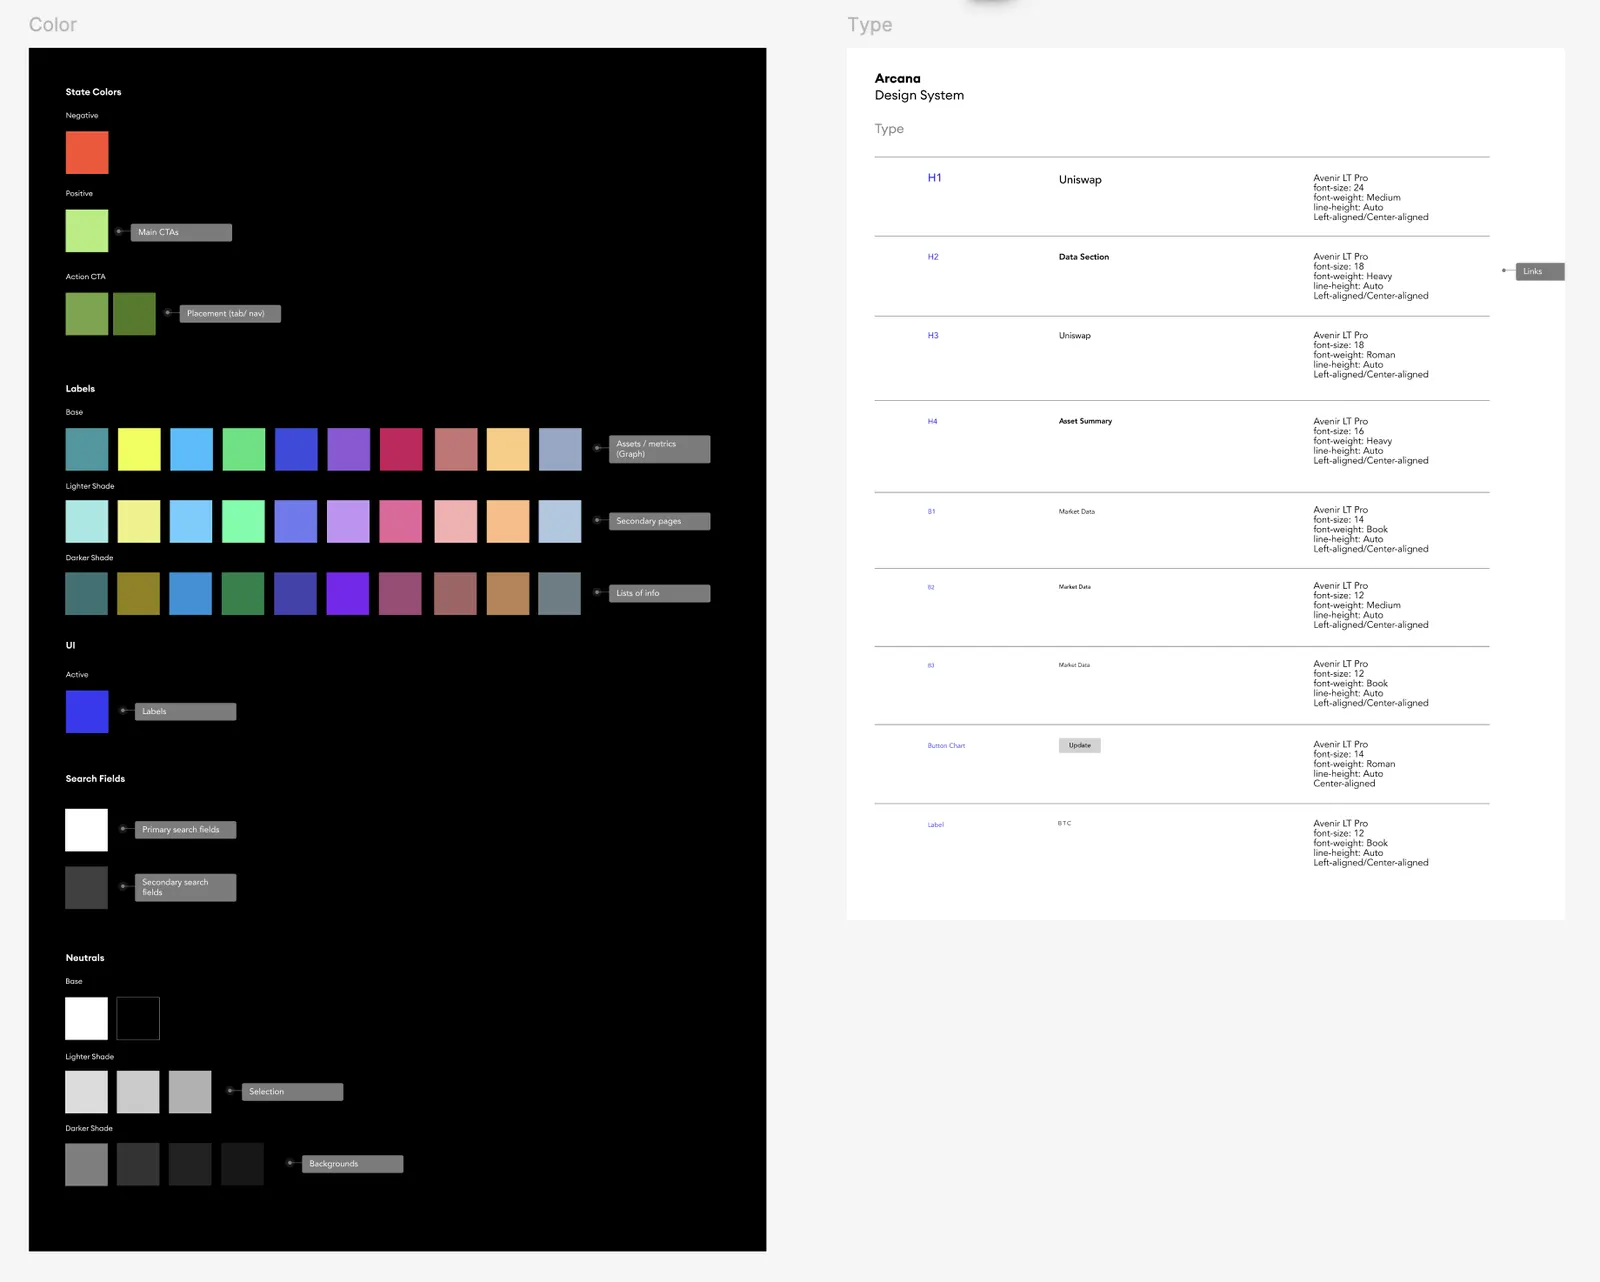
Design system: the color palette with a meaning for each color, in dark and light themes
MVP information architectureDesign system
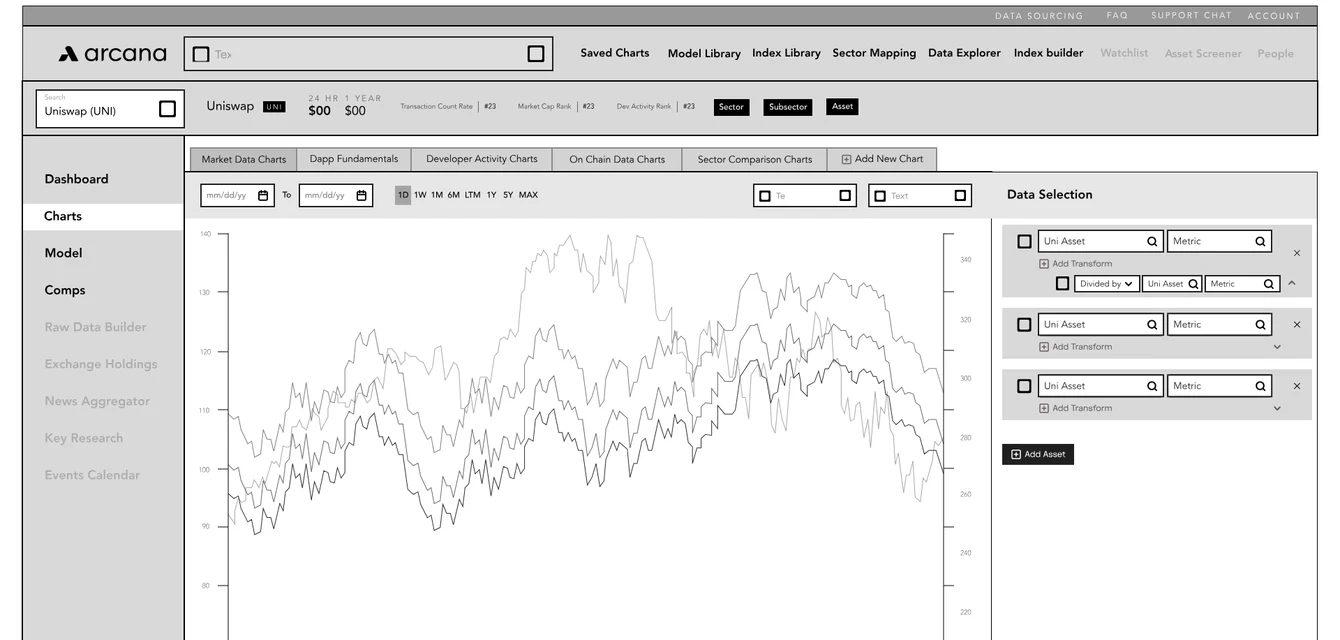
Early wireframe sheet: tables and charts
Wireframe: market data charts
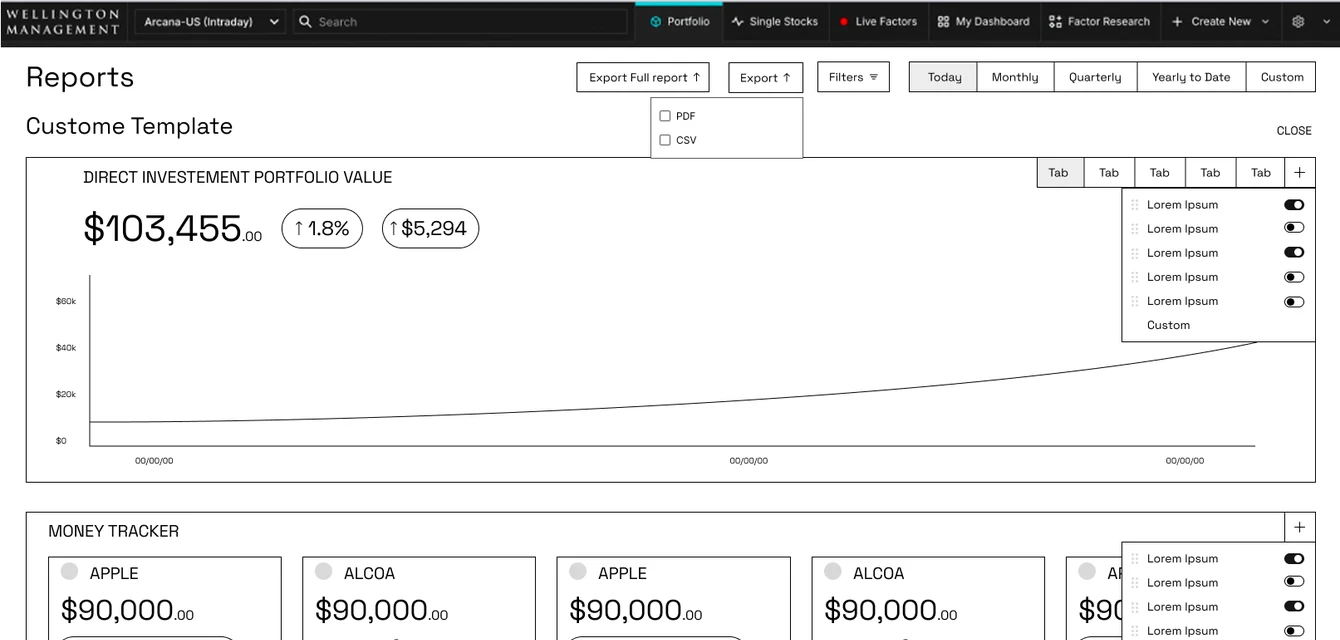
Wireframe: reports with column options
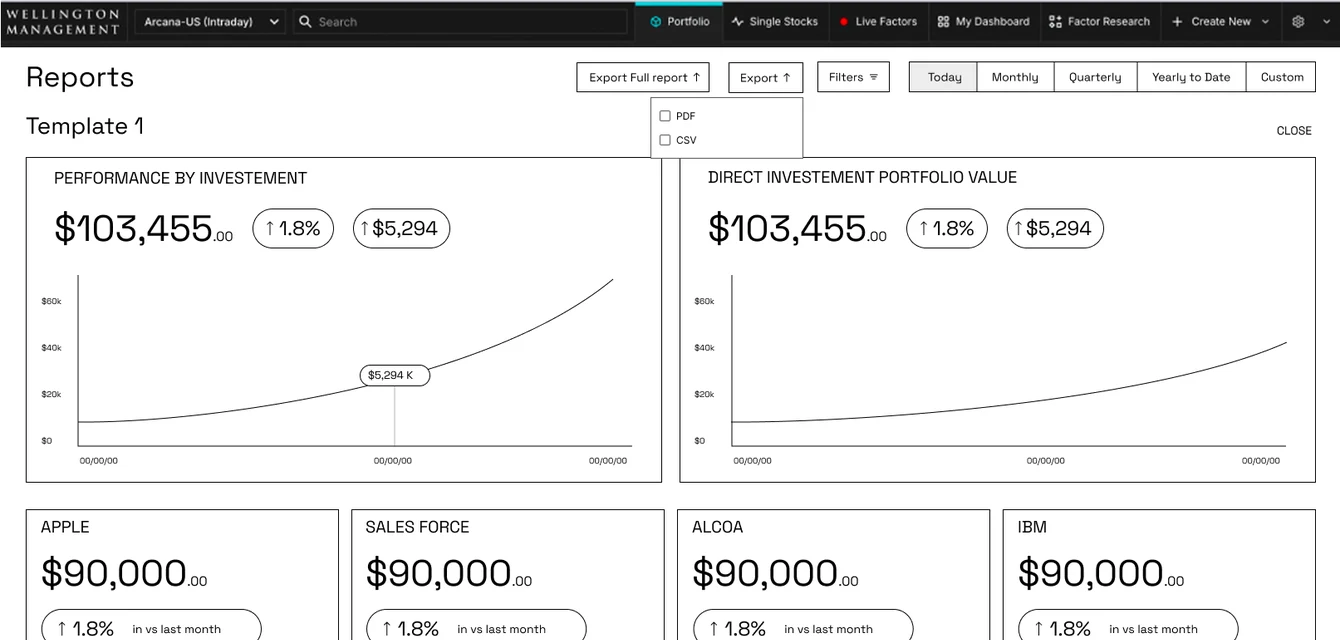
Wireframe: reports, template 1
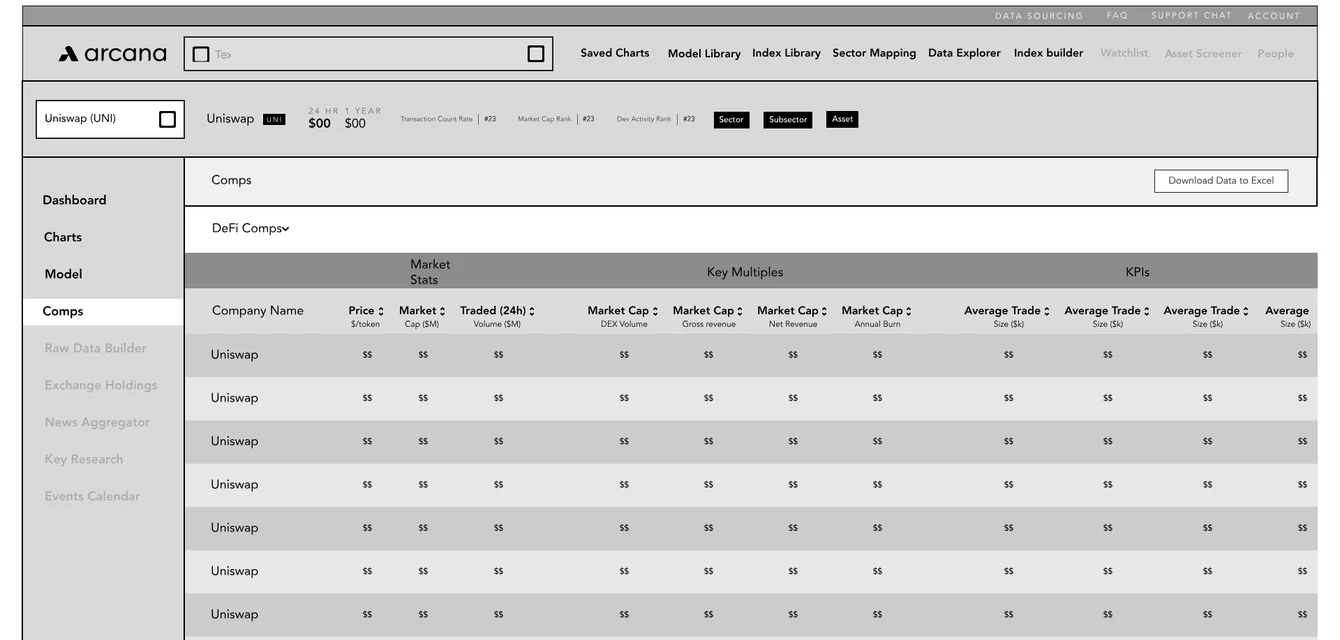
Wireframe: comps table
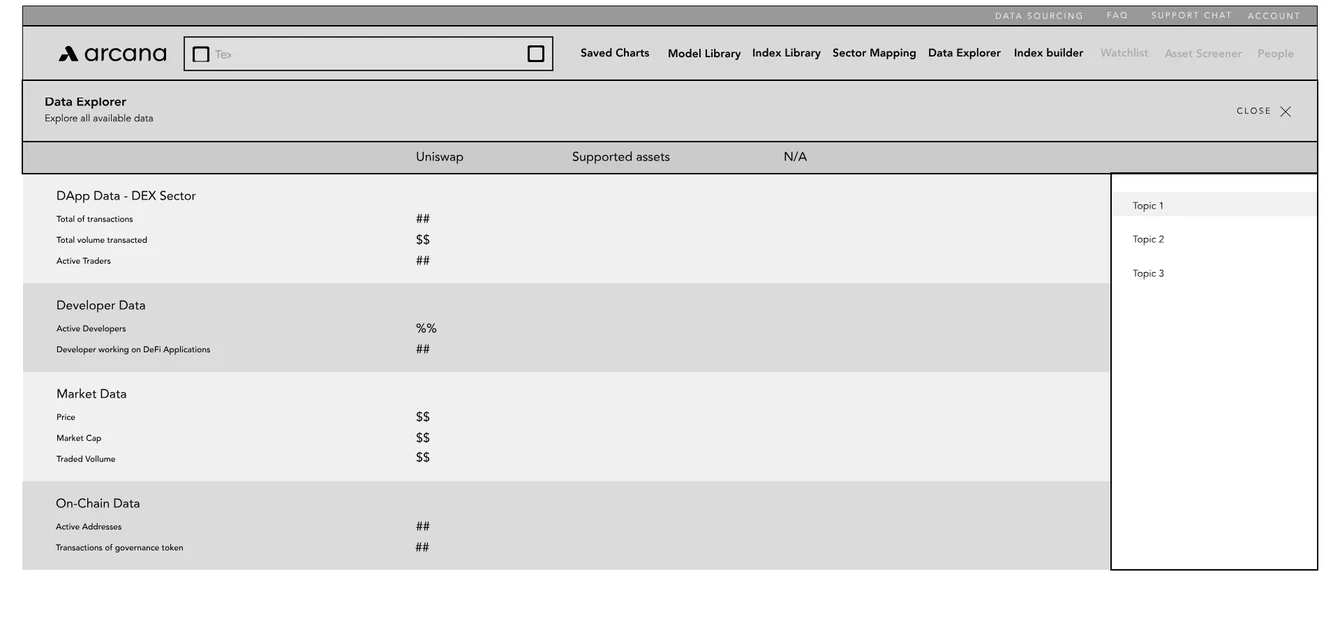
Wireframe: data explorer
Wireframes · first phases
03

Key decisions

Decision 1

Showing options, more than opinions

Early on, the founders didn't ask about functionality. They asked about looks: lots of color, with a Bloomberg-style screen as the reference.

Listening closer, I saw they wanted two things at once — a rich, colorful interface and a platform people could understand at a glance. Color with no system would cost them the second.

So I designed both side by side: color used freely, and a small color system where every color carries a meaning. The system gave them the look they wanted and the clarity they needed.

They chose the system — an option they hadn't asked for — and it shipped that way for client testing. It was the moment they started treating me as part of their team, and the start of three years working together.

It also set how we worked from then on: features like the paywall and chart hover states came to the team as two options to choose from, not a single answer to approve.
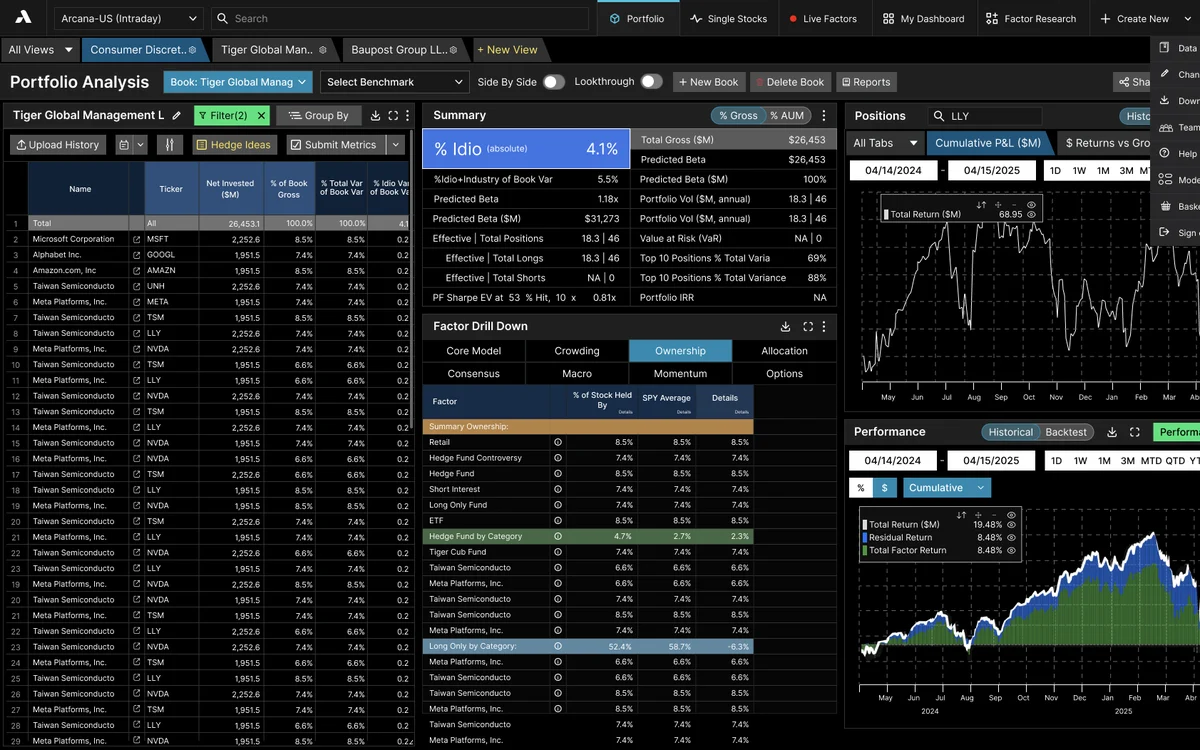
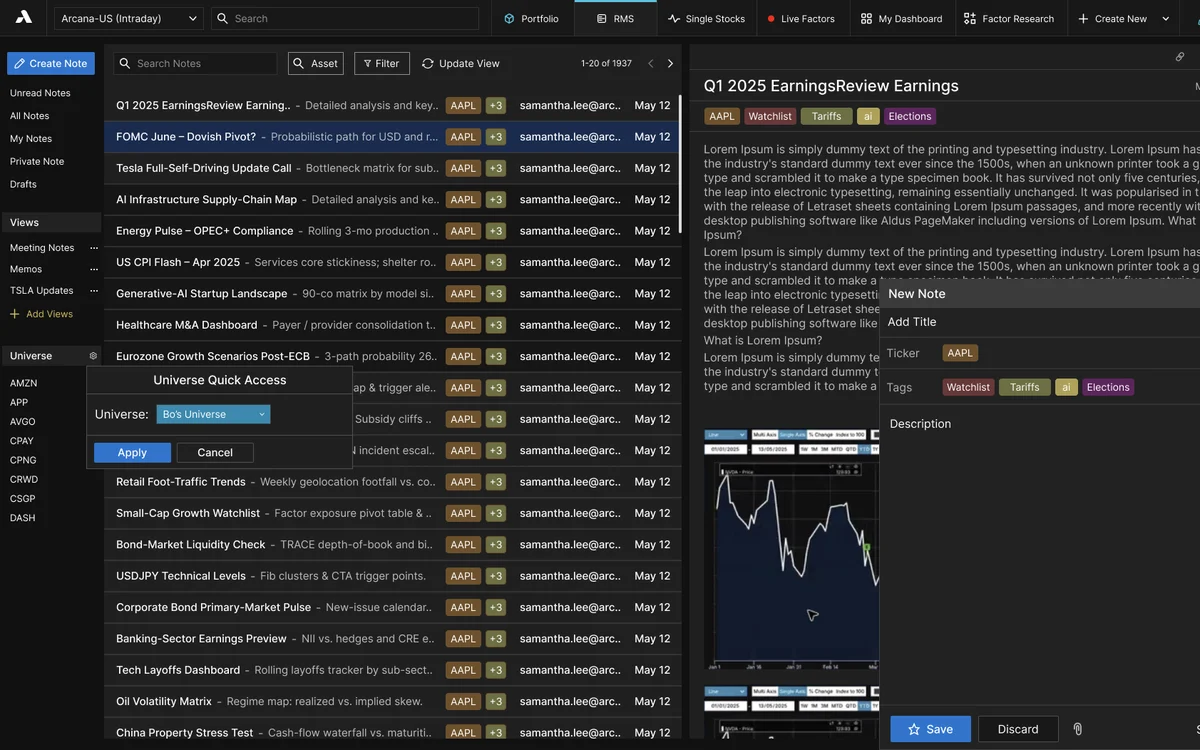
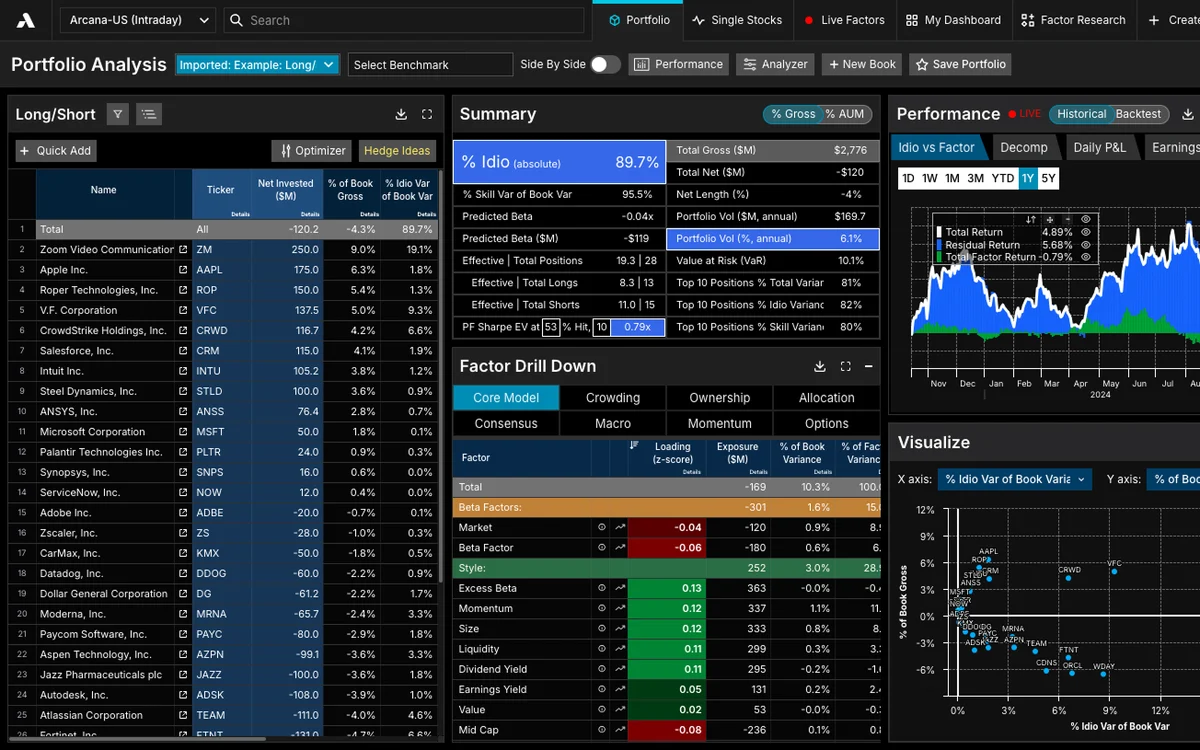
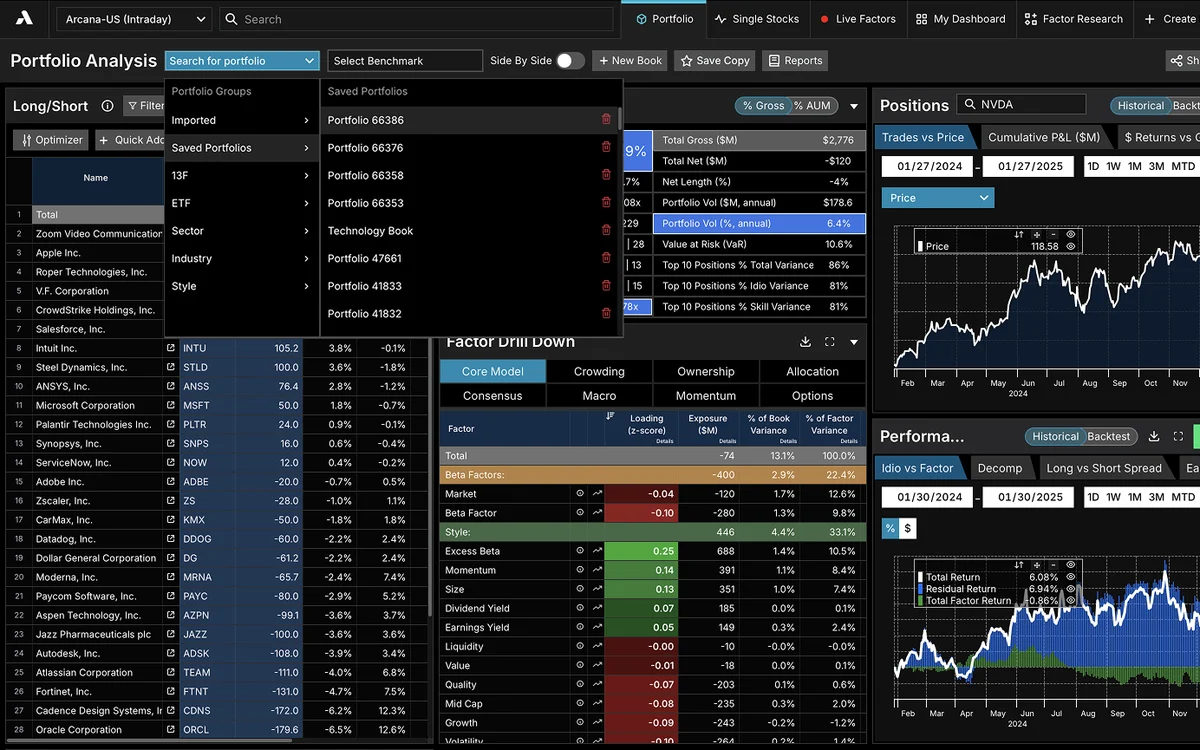
Portfolio overview with positions, charts and performance
Portfolio overview with news and earnings
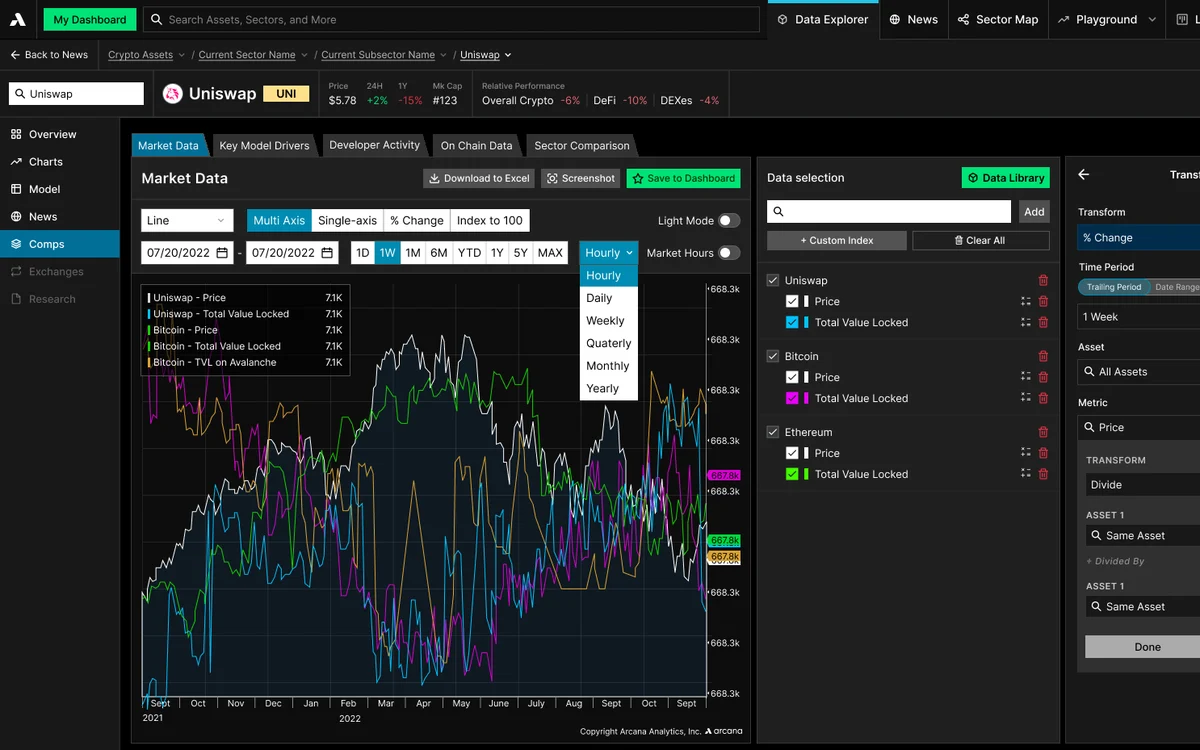
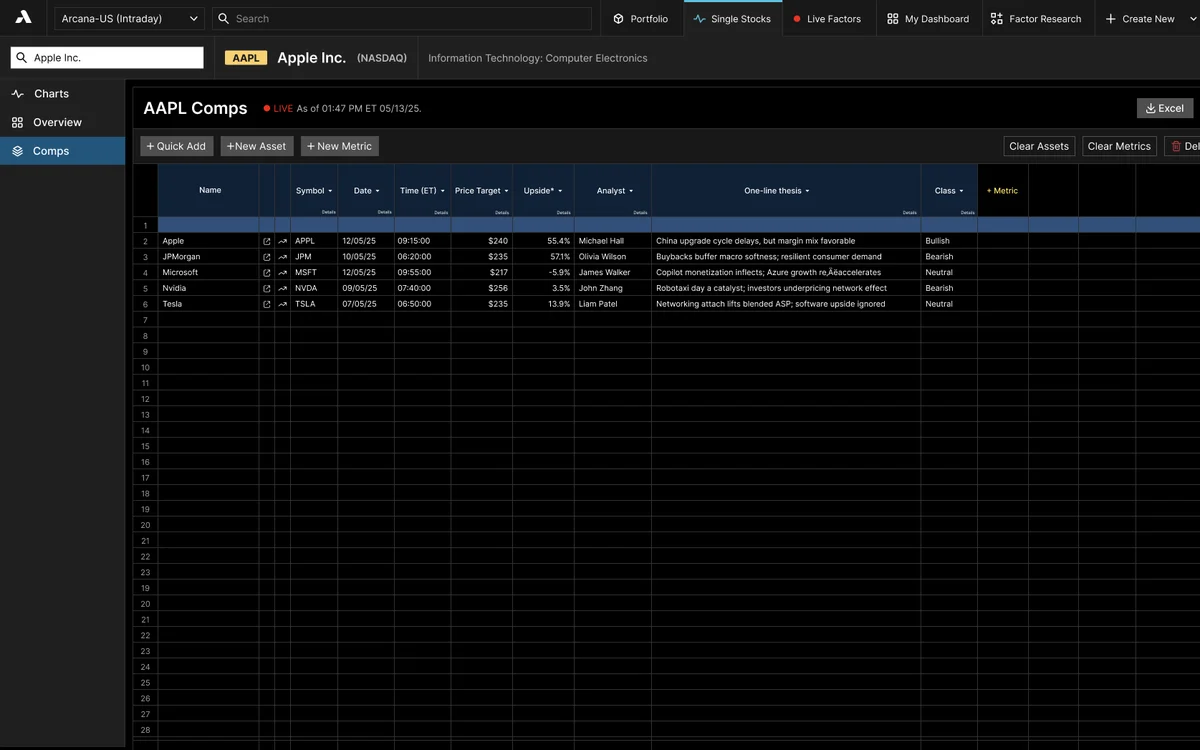
Comps table
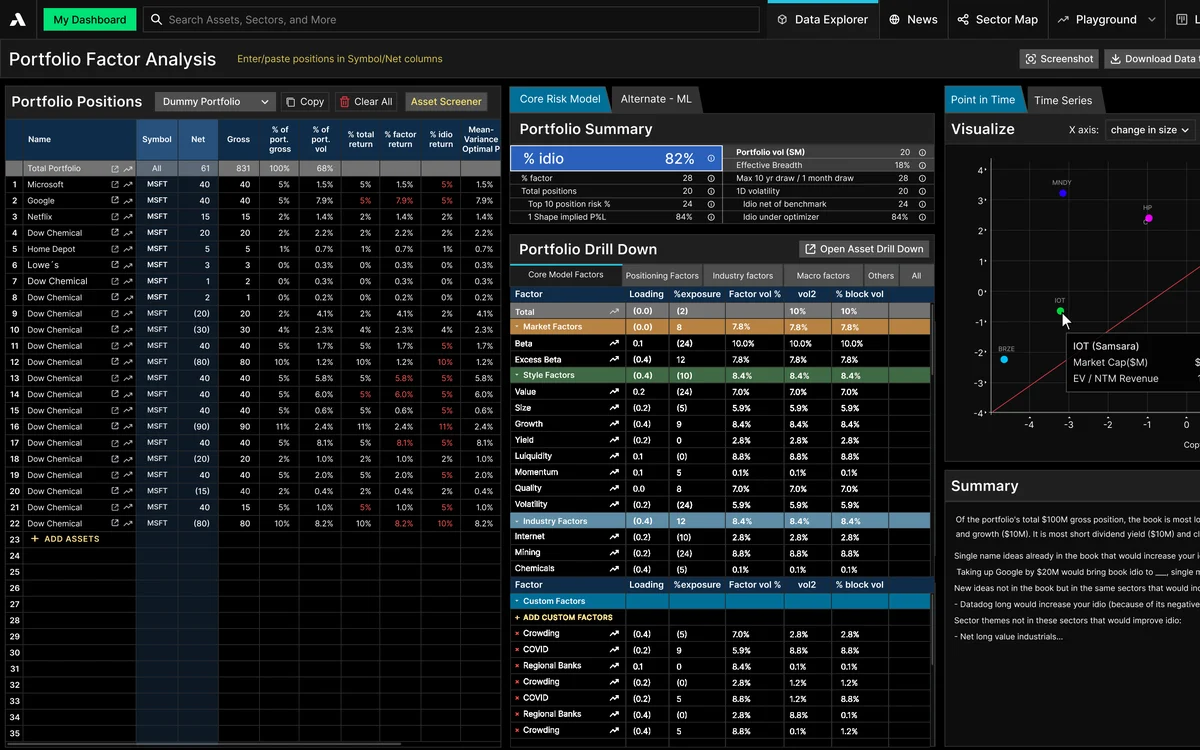
Portfolio analysis with factor exposure
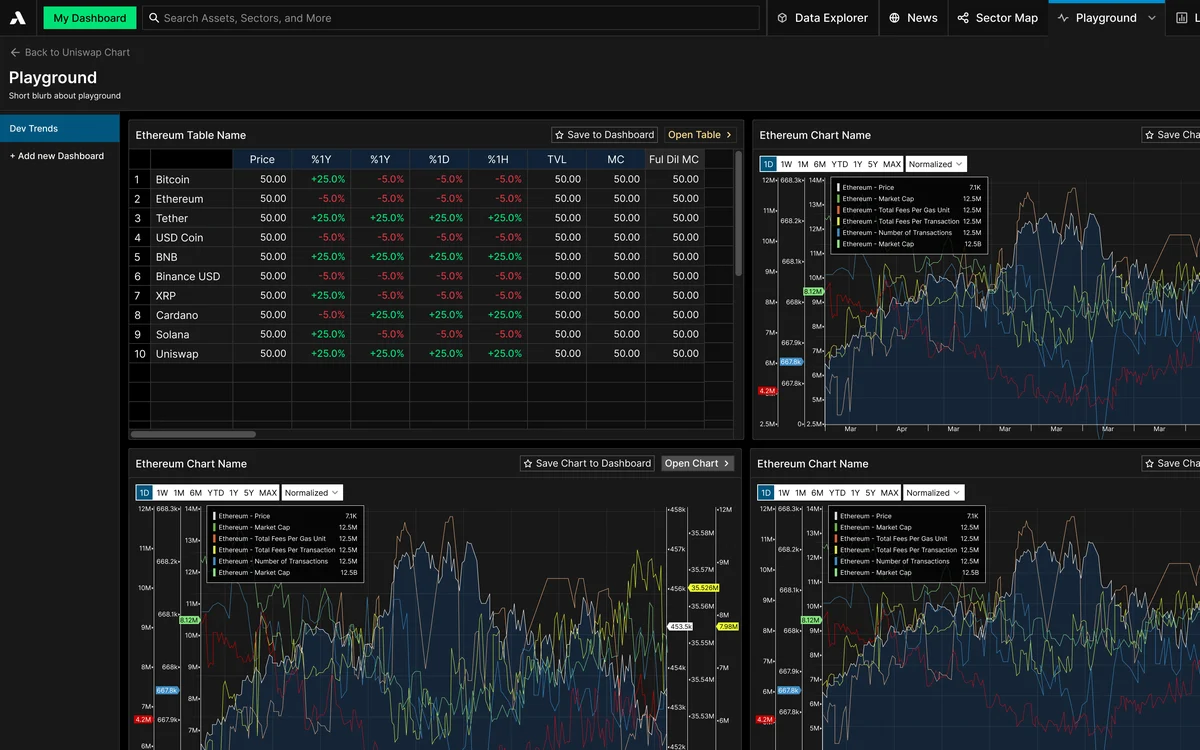
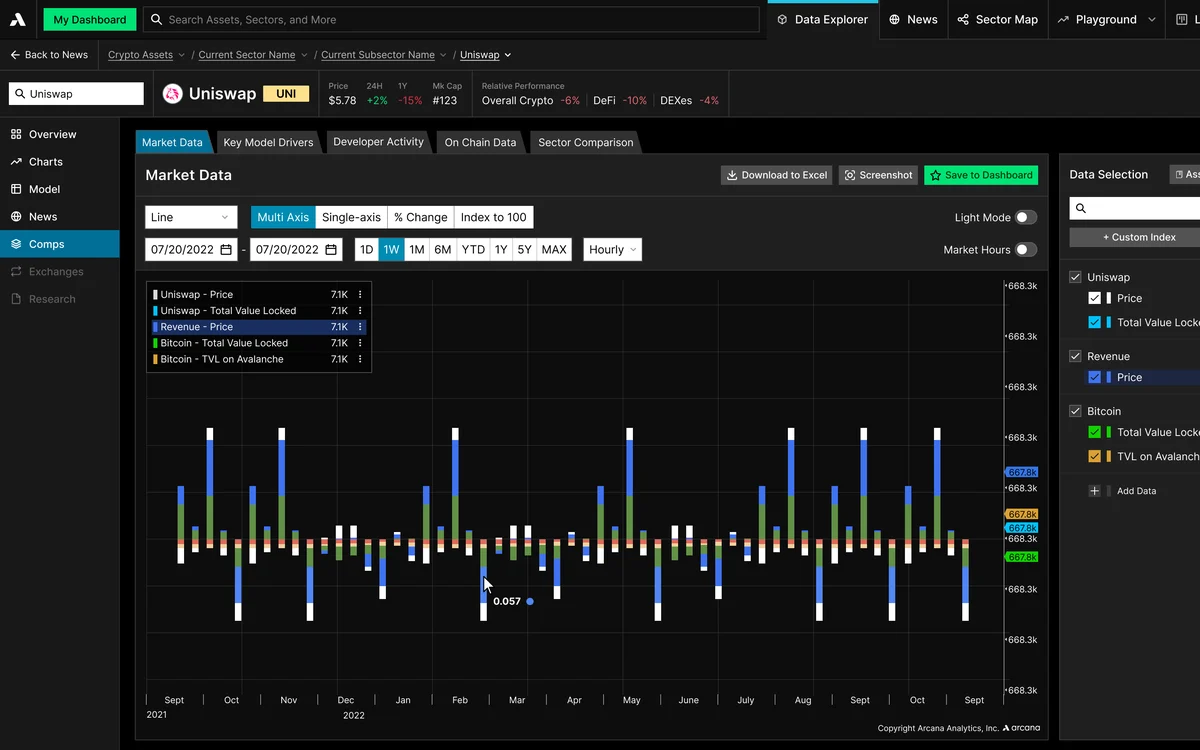
Playground dashboards with tables and charts
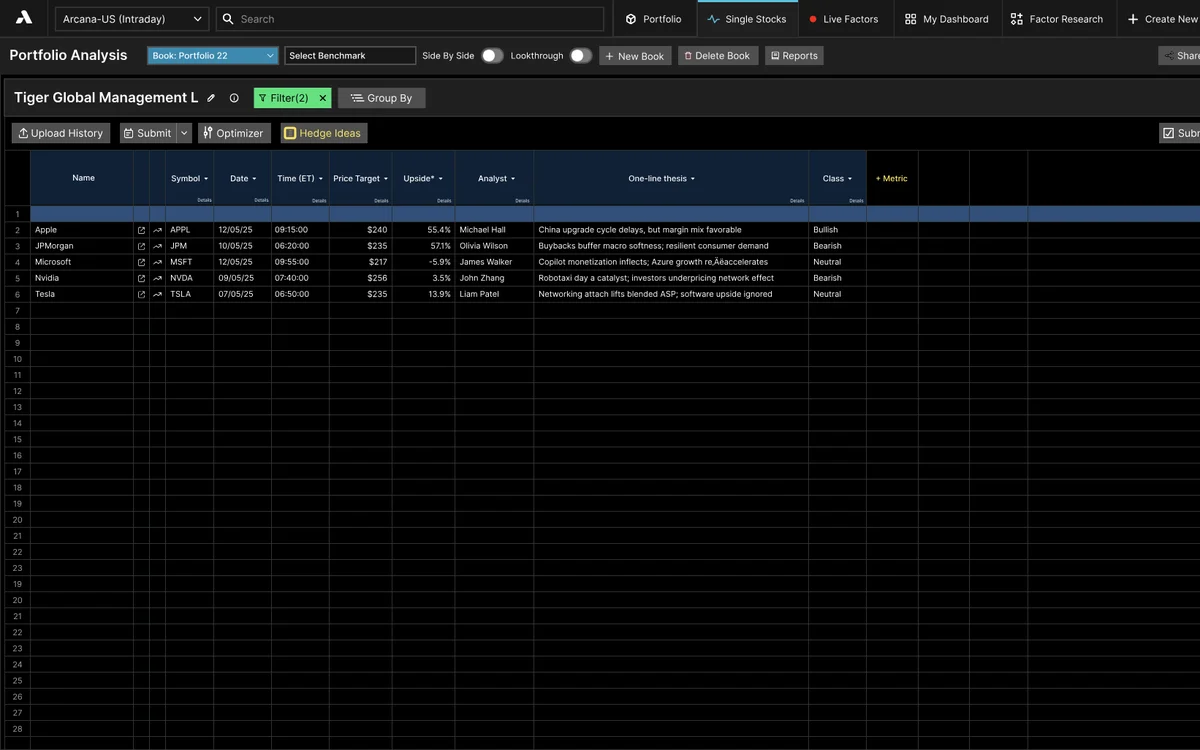
Portfolio analysis dashboard
Comps view
Chart hover option: one data point at a time
Portfolio factor analysis
Comps table, alternate view
Shipped · the color system in use
Decision 2

Speed came from the system, not shortcuts

By the second year, client feedback arrived fast, and the company's strategy was to act on it fast — to keep their customers happy and keep the product growing. Sometimes we designed a new page of the product in a single week.

I was trained to make everything as close to perfect as possible, so sprints that fast were a real challenge: the work didn't need to be perfect, but it needed to be fast.

Together with the brand team, I built an extensive system — buttons, dropdowns, status chips, table cells — that the developers and I could both build from. When a new feature stayed within the system, it came together quickly and stayed organized.

And the whole product stayed consistent — a core rule of good UI.

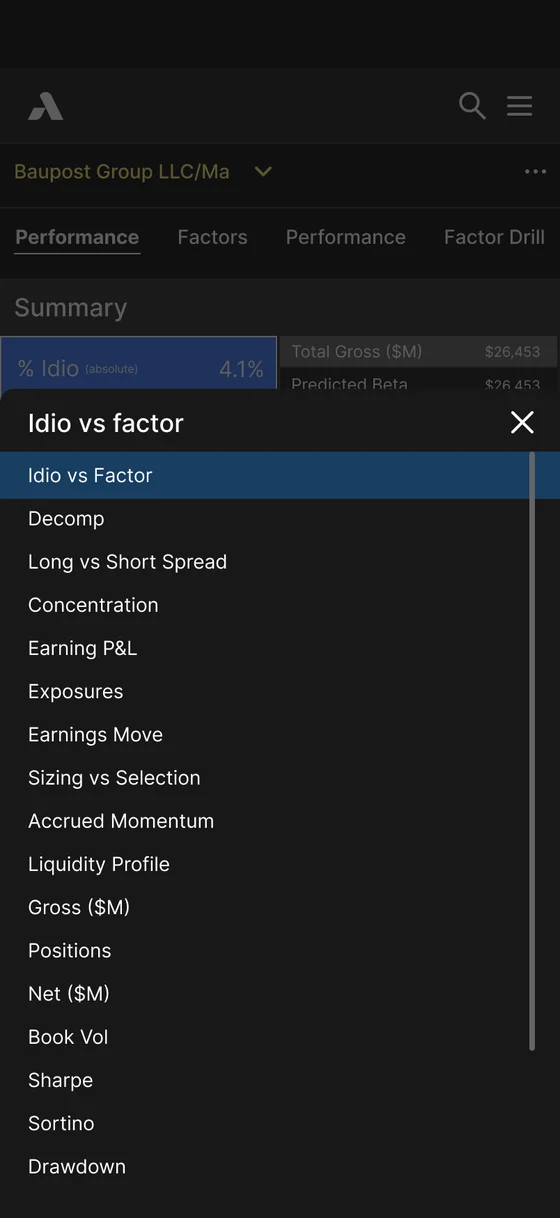
iOS app: Idiosyncratic factor dropdown
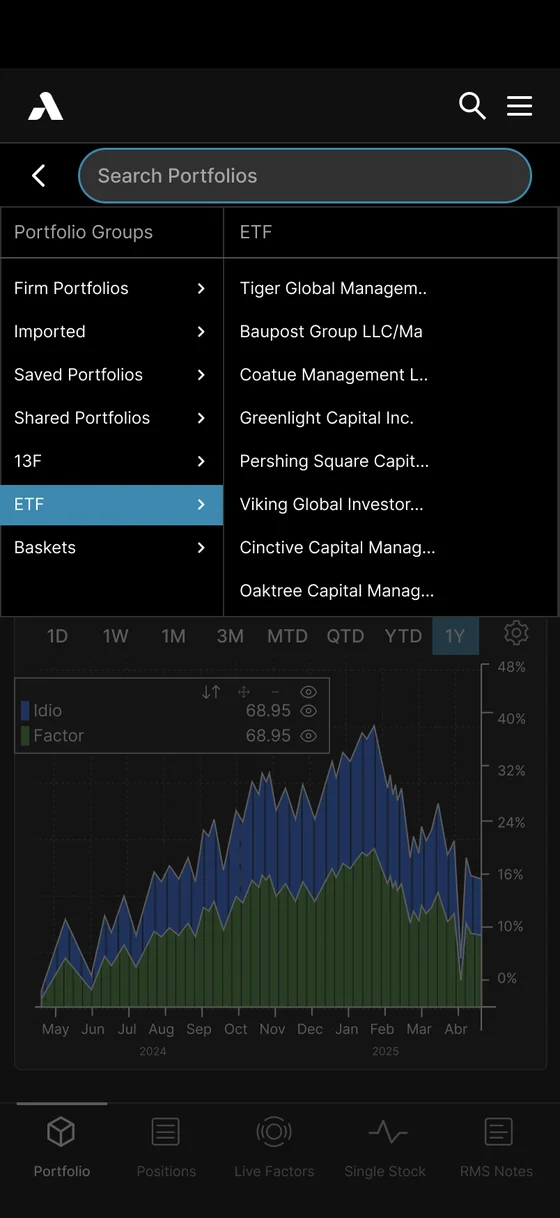
iOS app: Portfolio dropdown
iOS app: Chart settings
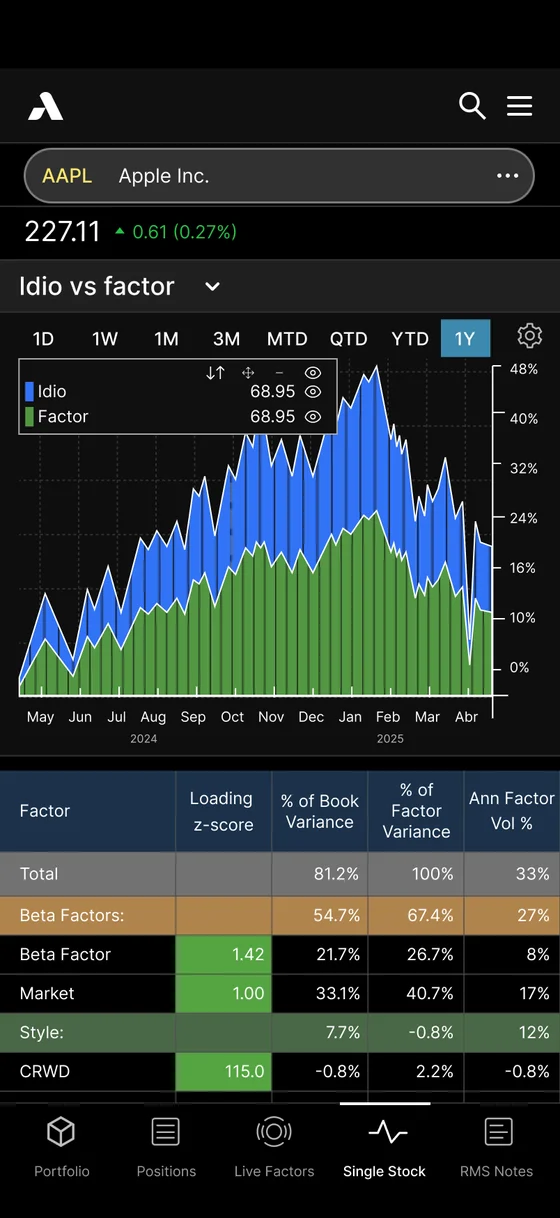
iOS app: Single stock detail
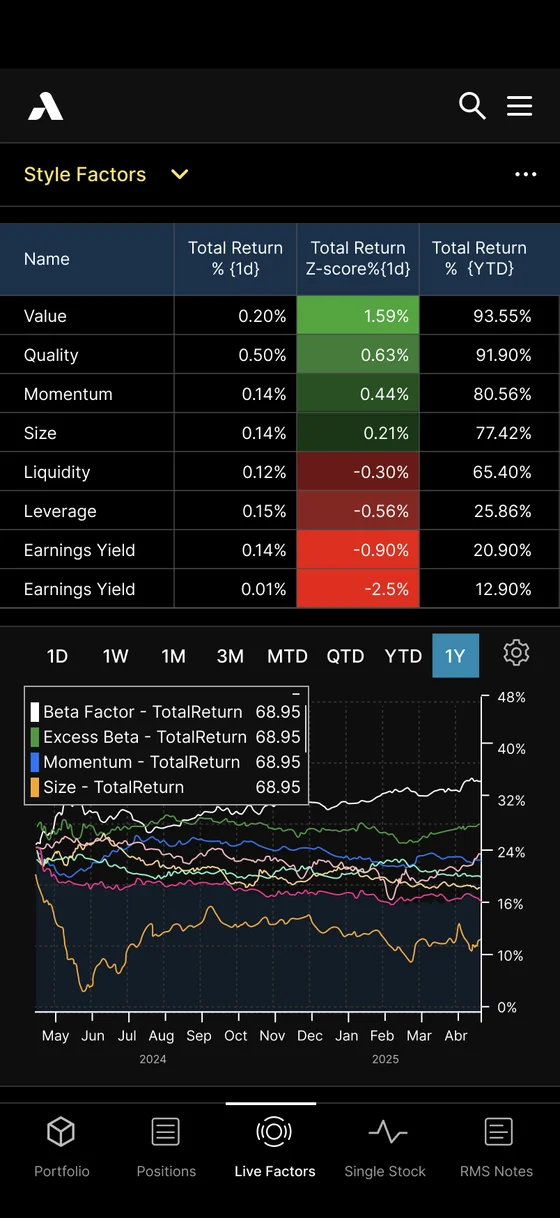
iOS app: Live factors
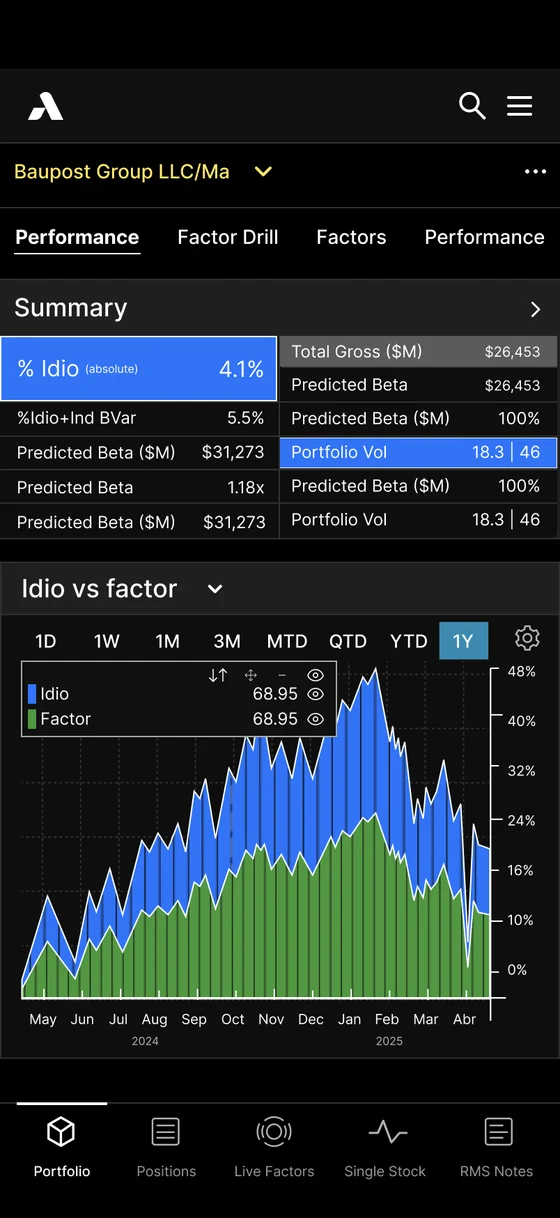
iOS app: Portfolio
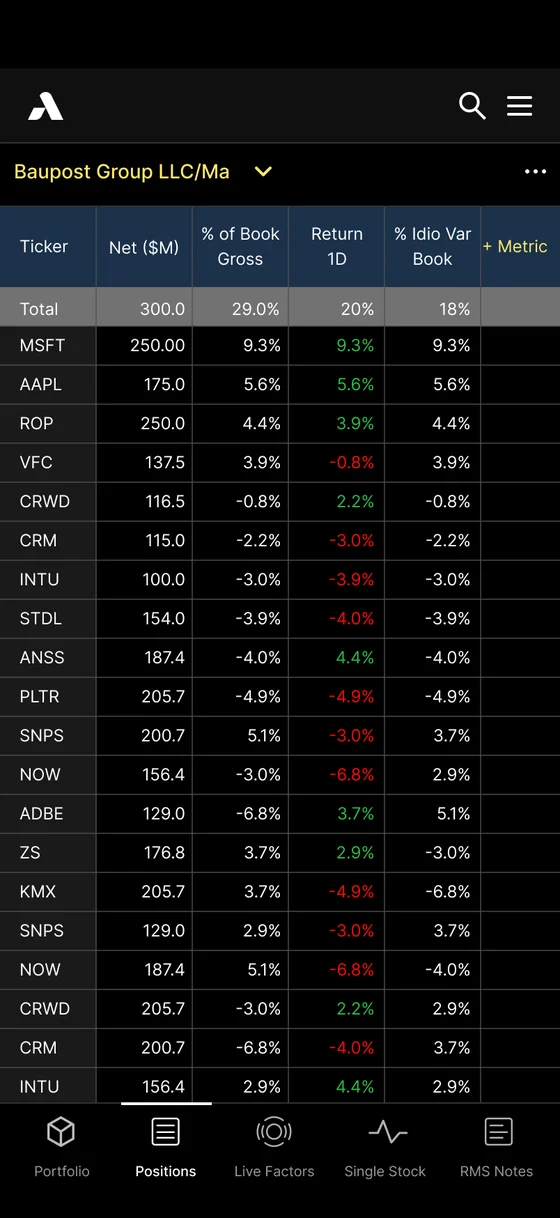
iOS app: Positions
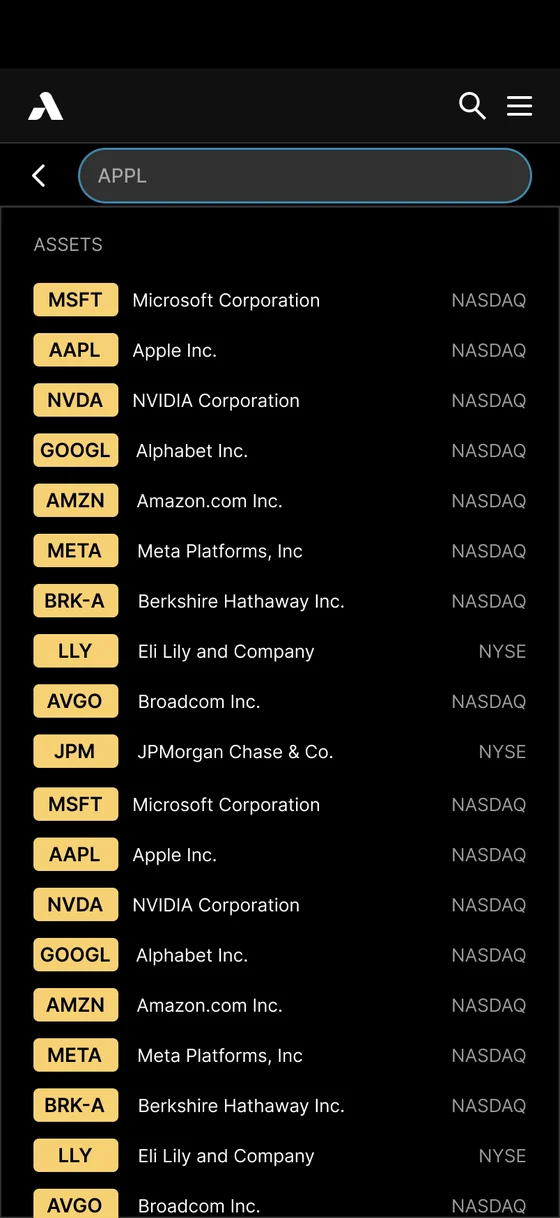
iOS app: Single stock chart
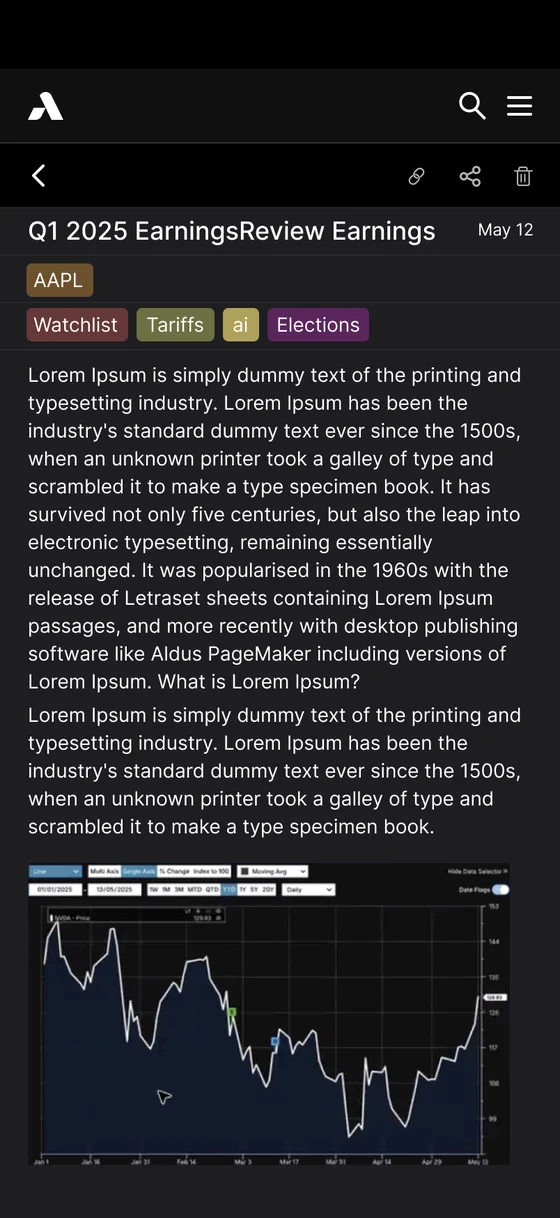
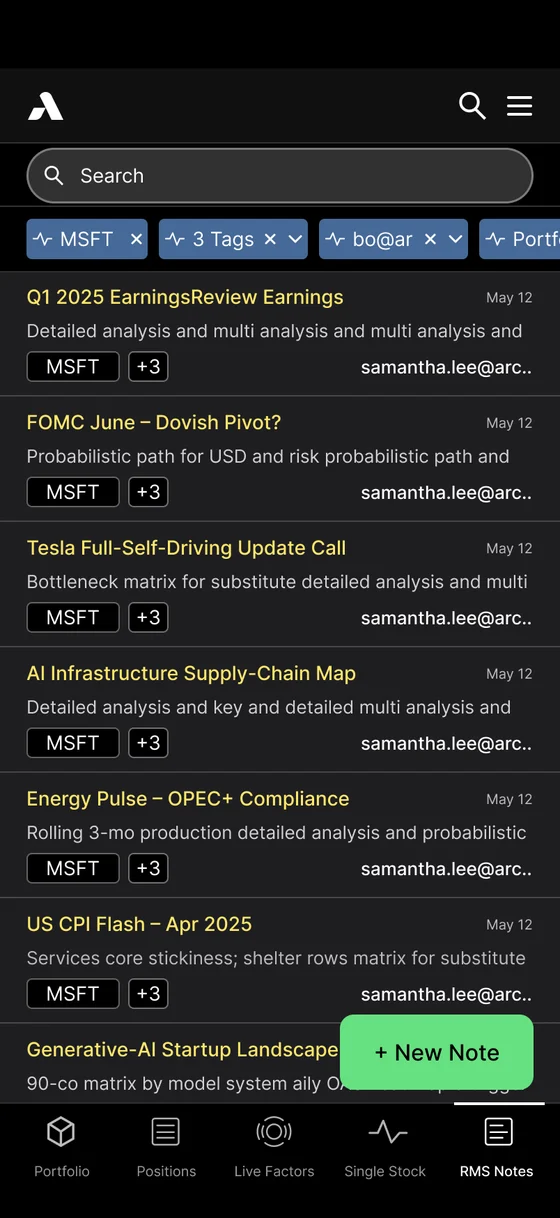
iOS app: Research feed
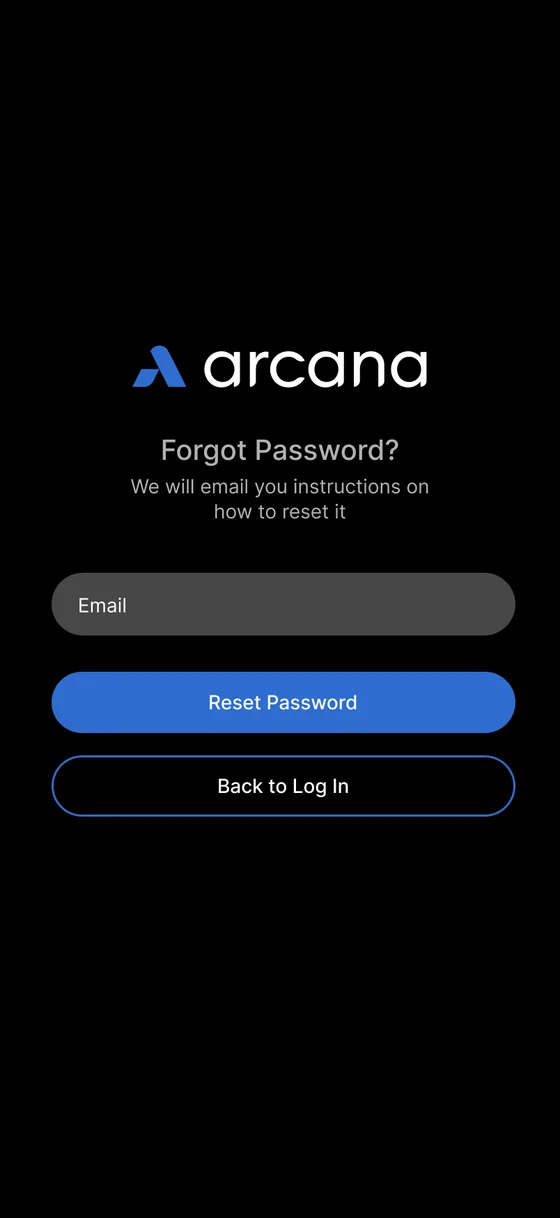
iOS app: Log in
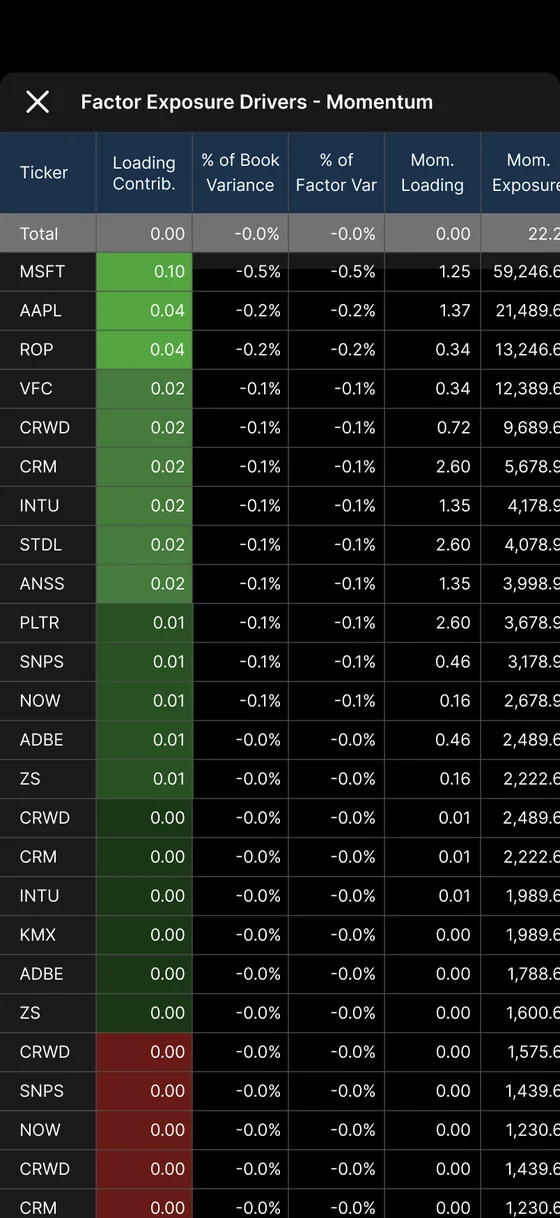
iOS app: Momentum factor detail
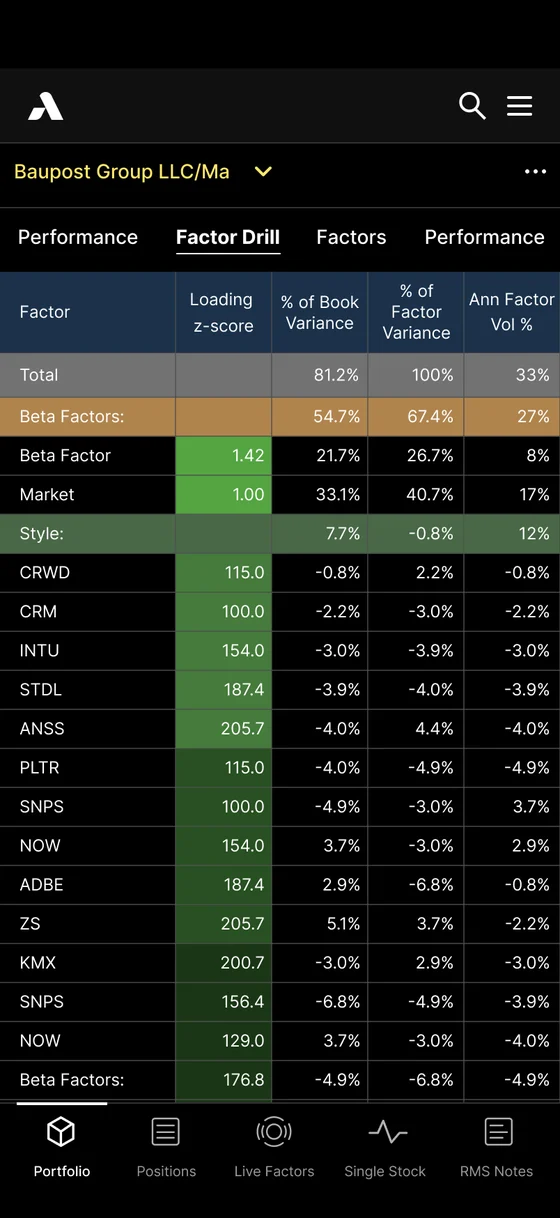
iOS app: Portfolio factor drill-down
iOS app · built from the same system
04

Three years of growth

After launch, the work kept coming: saved views, alerts and thresholds, sharing and permissions, custom baskets, heatmaps, correlation and stress test widgets, an iOS app — plus marketing work like one-pagers, a magazine ad, business cards and social posts. The client scheduled projects around my availability, sometimes waiting a month so I could take them on.

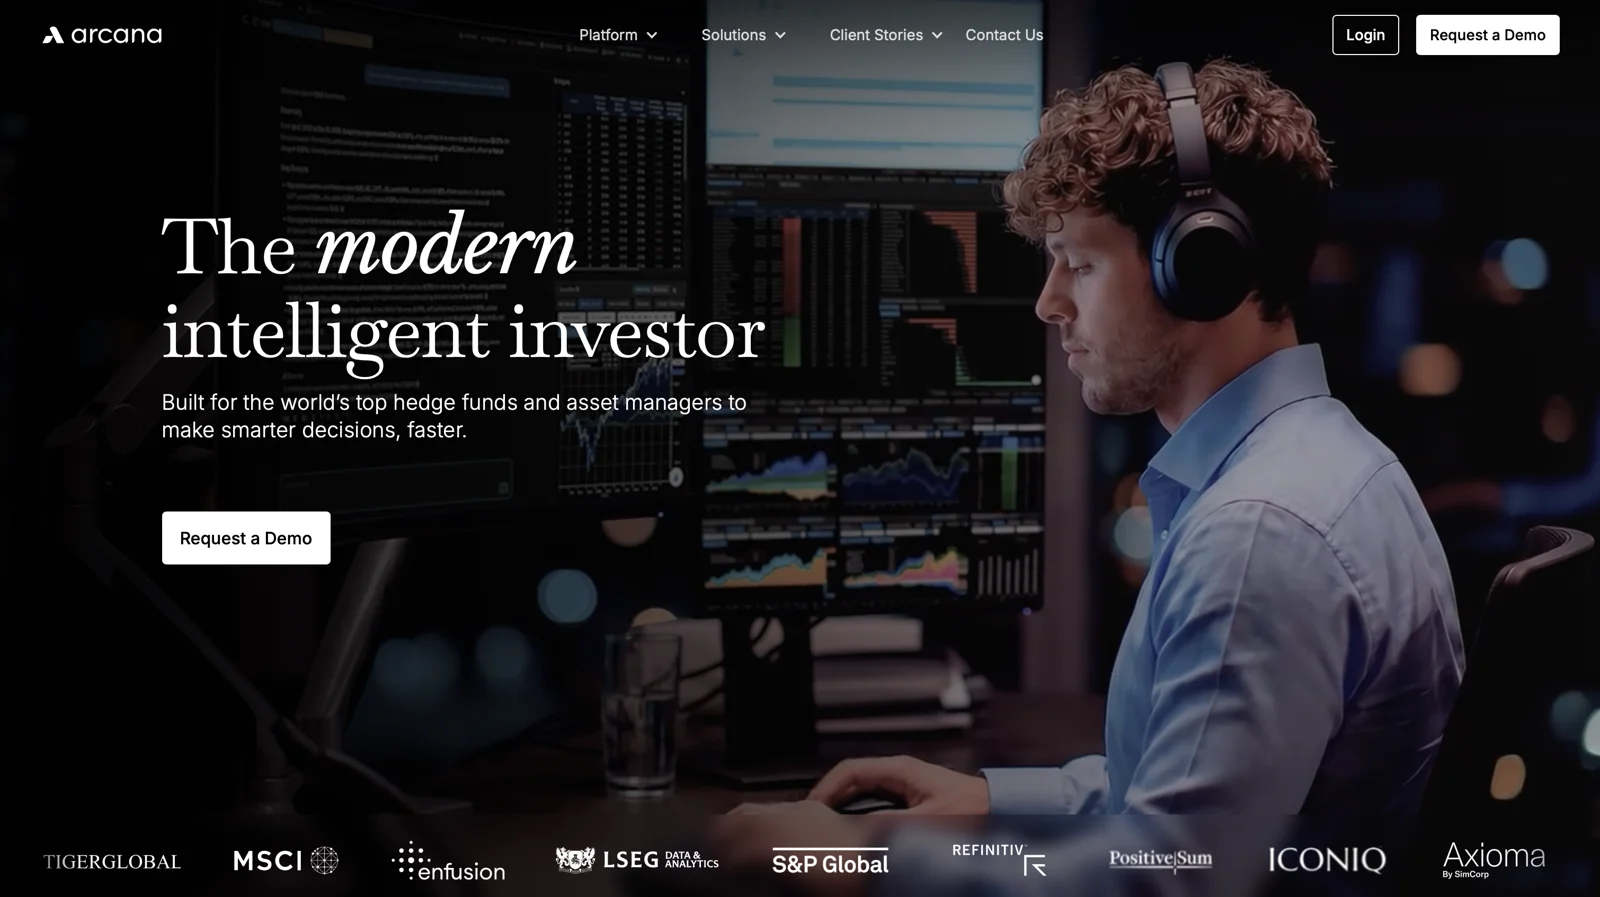
The company's website today: 'The modern intelligent investor', with the platform on screen behind an analyst
Today · the website
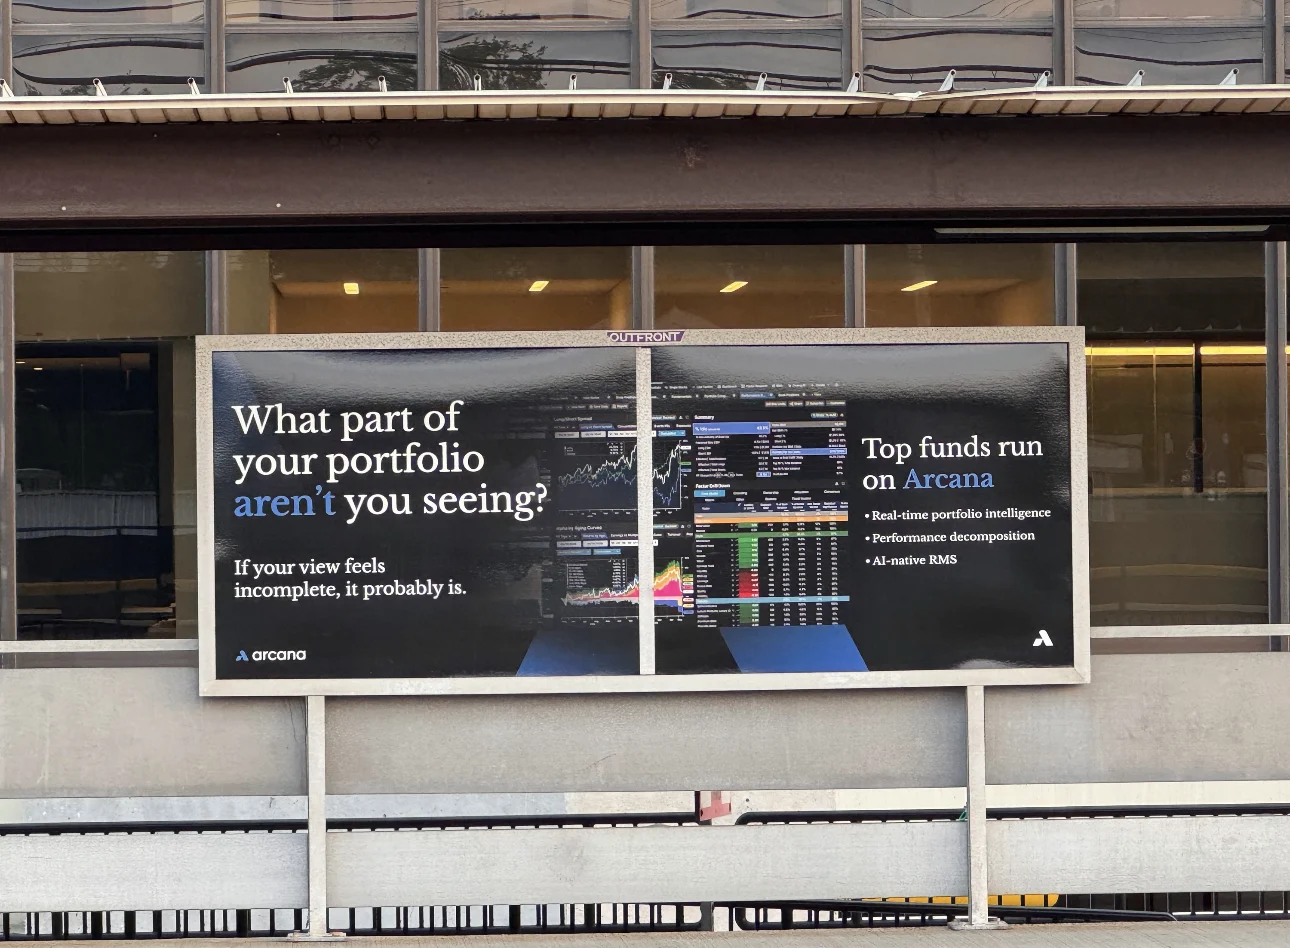
Outdoor billboard: 'What part of your portfolio aren't you seeing?' with the platform's screens
Today · the platform at Greenwich Station
05

Outcome

300+

institutions powered by the platform, trusted by firms managing over $20T in assets

3 yrs

retained, and requested by name

3rd

funding round, now being raised

“[The platform] has become table stakes if you are serious about portfolio construction and risk.”

— Senior PM, large multi-manager fund
← All work Next: Insurance claims and repair network →